Updated
P&L analysis: finding what drives the margin before the quarter ends

A profit and loss analysis compares revenue, costs and margin across periods, plans and parts of the business to find out why profit moved. To be useful, it needs three things: a closed month with accruals booked, a structure by cost centre, product or customer rather than only by cost type, and a split of every margin change into price, volume, mix and cost effects.
In Germany, most companies read their P&L through the BWA (the monthly management report from your tax advisor) or the HGB income statement (GuV). Both are built for the tax office and the annual accounts, not for running the business. P&L management that finds margin problems early needs a second view on the same bookings, every month rather than at quarter-end.
What does a P&L analysis show, and what does it miss?
A P&L tells you that something changed. Revenue up 8 percent, gross margin down two points, personnel costs up. On its own, it rarely tells you why. Was it a price change, a shift to lower-margin products, a supplier increase, or simply an invoice booked in the wrong month?
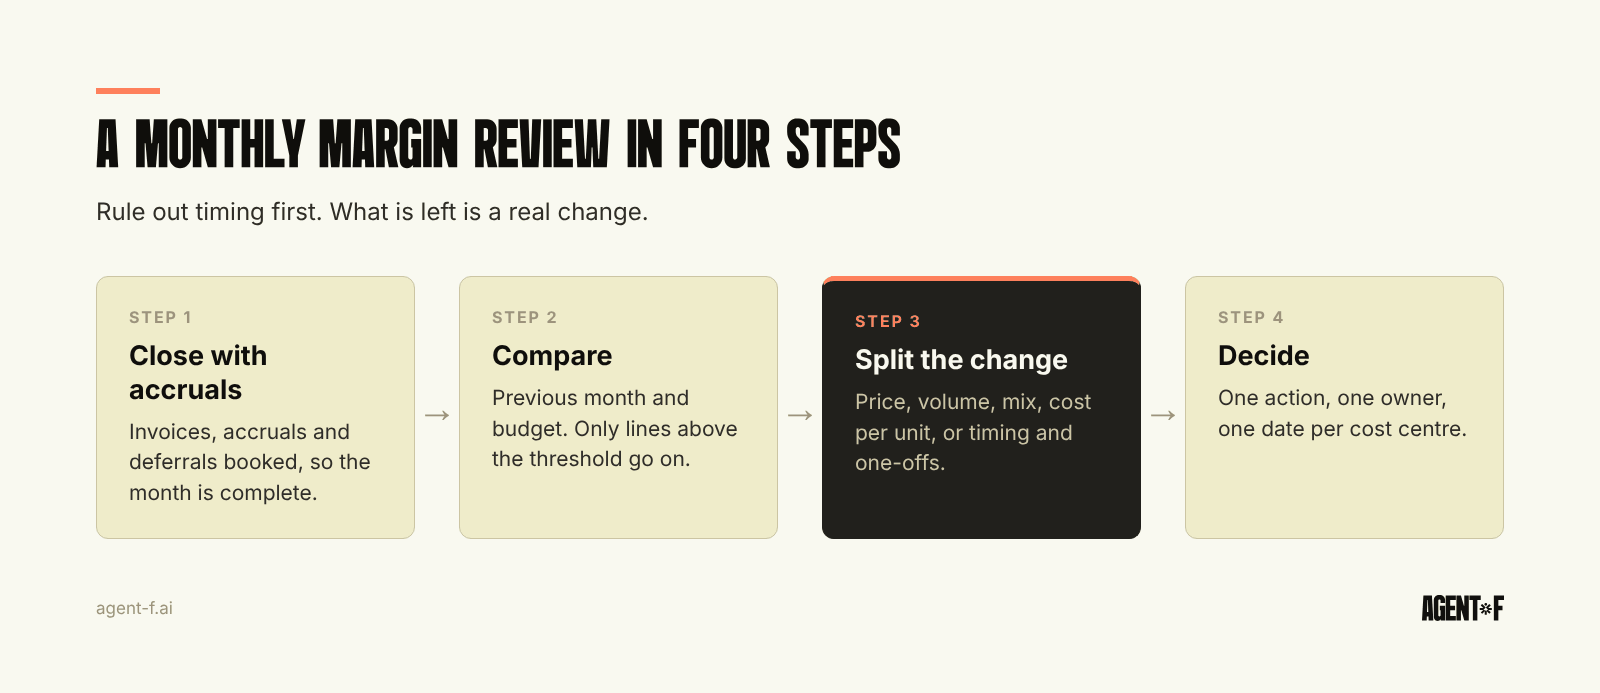
A useful analysis answers four questions in order:
- Is the month complete? Missing supplier invoices, unbooked accruals and revenue not yet deferred distort the comparison more than any business effect.
- Where did it change? Which cost centre, product line, customer group or entity.
- What kind of change is it? Price, volume, mix, cost per unit, or a one-off.
- What do we do about it? A decision, an owner and a date.
Most monthly reporting stops after the first line of the P&L. The value is in the next three steps.
Why does the German GuV hide your margin drivers?
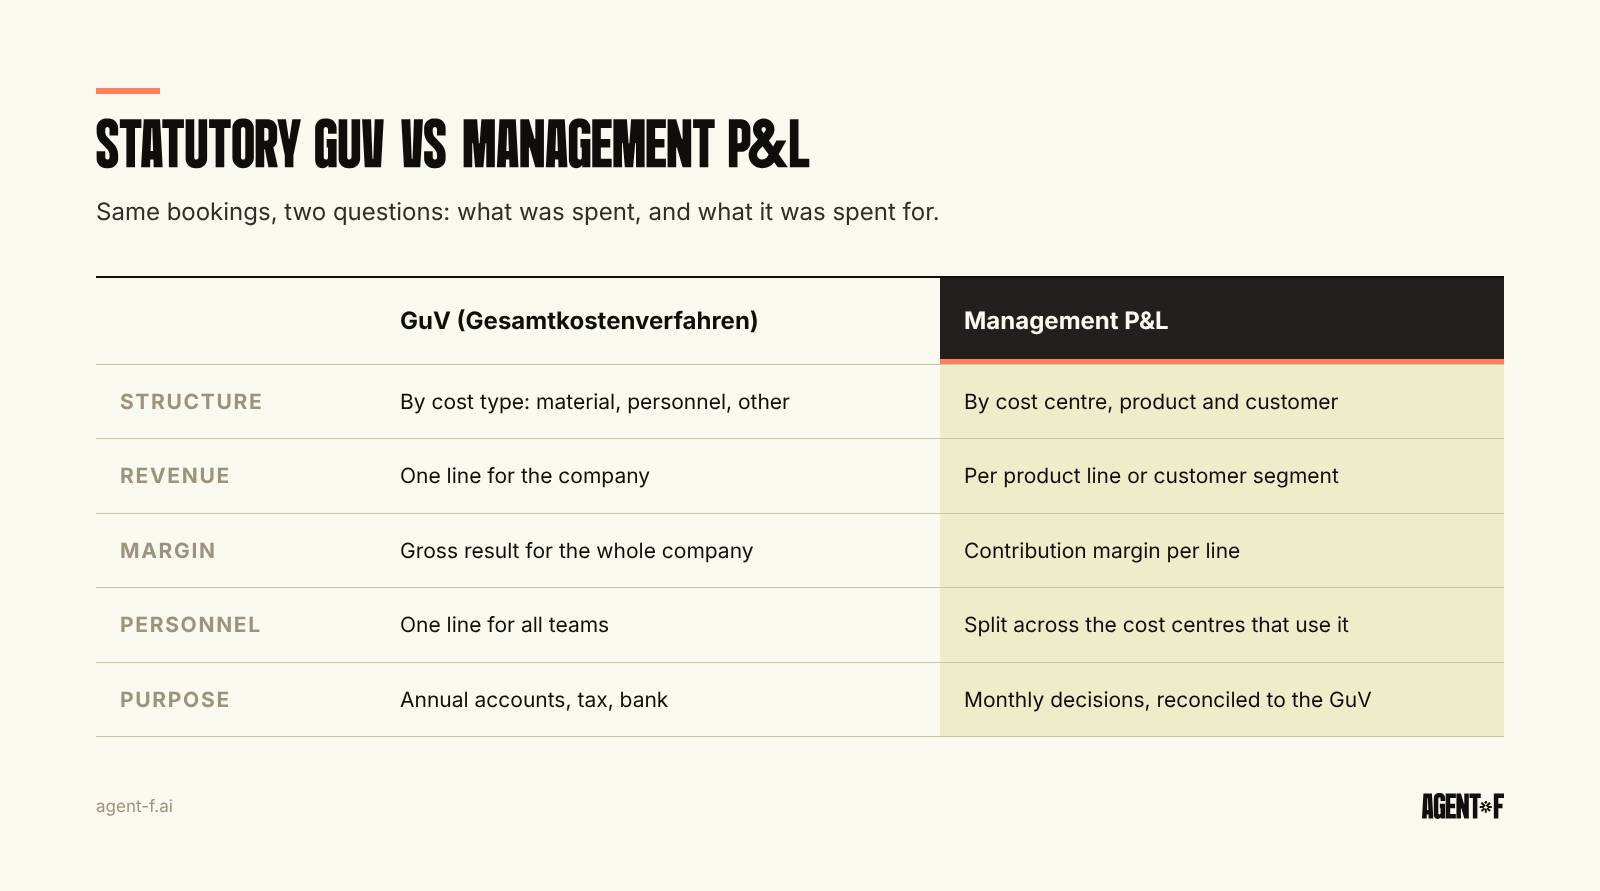
The German Commercial Code (HGB) allows two formats for the income statement in § 275. Most small and mid-sized German companies use the nature of expense method (Gesamtkostenverfahren). It lists revenue, changes in inventory, own work capitalised, other operating income, then costs by type: material, personnel, depreciation and other operating expenses.
That structure tells you what you spent money on, not what it was spent for. Personnel costs include engineers building the product, salespeople and the finance team in one line. Material costs are shown for the period, not matched to the products sold. In a manufacturing company, a month of stock build-up looks like a margin problem until the inventory change is read alongside it.
Small and medium companies may even combine revenue, inventory changes, own work and material costs into a single gross result (Rohergebnis) under § 276 HGB. The BWA follows a similar logic by cost type, usually on the SKR04 chart of accounts. It is good for checking that the books are complete and for talking to the bank. It is not built to show which product, customer or project earns the margin.
The alternative format, the cost of sales method (Umsatzkostenverfahren), groups costs by function: cost of sales, selling and administration. It is closer to a management view and common in larger and international groups, but it is still one statutory layout for the whole company.
How do you build a management P&L by cost centre and product?
A management P&L uses the same bookings as the GuV but adds dimensions. Each booking carries, besides the account, a cost centre and, where it makes sense, a product, customer, project or entity. The statutory GuV and the management P&L are then two reports on one ledger, not two sets of numbers.
A practical structure for a growing company:
- Revenue by product line or customer segment.
- Direct costs attributed to that revenue: material, purchased services, payment fees, hosting, direct labour.
- Contribution margin per line, which is where most margin questions are answered. We describe the method in contribution margin by product, customer or project.
- Cost centre costs for sales, product, operations and administration.
- Operating result, then the items below it: depreciation, interest, taxes.
Two rules keep it honest. First, the total must reconcile to the GuV every month, so nobody argues about which number is right. Second, allocations of shared costs should be simple and stable. A complex allocation key that changes every quarter makes trends unreadable.
Which month-over-month changes deserve a closer look?
Not every movement needs an explanation. Set a threshold per line, for example a change above a fixed amount or a few percentage points of margin, and look only at what crosses it.
For each change above the threshold, split it:
- Price effect. Did average selling prices or discounts change?
- Volume effect. Did you sell more or fewer units, hours or subscriptions?
- Mix effect. Did the share of lower-margin products or customers grow?
- Cost effect. Did purchase prices, wages or hosting costs per unit change?
- Timing and one-offs. Is it a late invoice, a missing accrual, a prior-period item or a one-time cost?
Timing is the most common cause and the cheapest to rule out. If accruals for recurring costs are booked each month, as described in accruals at month-end, most false alarms disappear. What is left is real.
Compare against two baselines: the previous month and the budget. The plan comparison per cost centre is covered in budget vs actual reporting. A handful of ratios, such as gross margin, personnel cost ratio and material ratio, give the trend at a glance; see financial KPIs for a growing company.
How do you get the analysis done before the quarter ends?
The main reason margin problems are found late is the calendar. If the tax advisor delivers the BWA three or four weeks after month-end, the September figures arrive in late October. By the time someone has exported them to a spreadsheet and added cost centres by hand, the quarter is over.
Three changes move the analysis forward:
- Close faster. Bank feeds, invoice capture and accruals in the same system let you close in days rather than weeks. Why reports arrive late is explained in real-time financial reporting.
- Book dimensions at the source. Cost centre and product are set when the invoice is captured or the order is created, not added afterwards in a spreadsheet.
- Review monthly, decide monthly. A 30-minute margin review in the second week of the month, with owners for each cost centre, catches a trend after one month instead of three.
How does Agent F help you find what drives the margin?
In Agent F, the GuV, the BWA and the management P&L are reports on one data model. Every booking carries its account on SKR04 and its dimensions: cost centre, product, customer and entity. Cost centres and products are suggested when invoices are captured and orders are created, each with a confidence score, and a person approves them.
During the close, Agent F suggests accruals with a confidence score, so a missing accrual is booked rather than explained in a meeting. Once the month is closed, budget vs actual per cost centre and custom reports on live data show which lines moved, and anomaly detection flags unusual entries for review. Splitting a change into price, volume, mix and timing stays with the people who know the business, working from complete numbers.
You can also ask in plain language, such as "why did gross margin in the hardware line drop in September", and get the answer from live data with the bookings behind it. The statutory GuV and the DATEV export for your tax advisor come from the same entries, and every adjustment sits in the audit trail.
To start, choose the three dimensions that matter most for your margin, add them to your cost centre and product setup, set a threshold for each P&L line, and schedule a monthly margin review with one owner per cost centre.
Learn how Agent F works, or see it on your own P&L at agent-f.ai/demo.
This article is for general information only and does not constitute tax or legal advice. Parts of it were generated with AI. Please consult your tax advisor or legal counsel before acting on it, and feel free to reach out at team@agent-f.com with any questions or for support.