Updated
Management reporting without Excel: custom rows, EBITDA and board reports from one ledger

Management reporting is the set of internal reports that tell leadership how the business is doing: a P&L in your own structure, EBITDA as you define it, results per entity and cost centre, and a short board report. It works without Excel when the report definition, meaning which accounts feed which row and how each metric is calculated, lives on the ledger and refreshes with every booking.
Most finance teams have plenty of reports and no place to keep the one the business actually reads. That report usually exists as a spreadsheet next to the accounting system, rebuilt from an export every month. This article is about moving the definition, not just the numbers, into the system.
Why is the standard P&L not the report management wants?
The P&L your system produces follows the chart of accounts and, in Germany, the statutory structure of the HGB (German Commercial Code). Section 275 HGB sets out two formats: the total cost method (Gesamtkostenverfahren), which groups costs by type such as materials, personnel and depreciation, and the cost of sales method (Umsatzkostenverfahren), which groups them by function. Neither contains a line called EBITDA, contribution margin or gross margin after fulfilment.
The BWA (the monthly management report from your tax advisor) adds a short results view, but its structure is fixed by the standard form and built for the whole client base of the tax firm. We explain how to read it in reading the BWA. It cannot show your three product lines, your two entities side by side, or the one-off legal costs that you want below the line.
So the controller builds a second P&L: same data, different rows. That second P&L is the management report. The question is only where it lives.
What does a report definition actually contain?
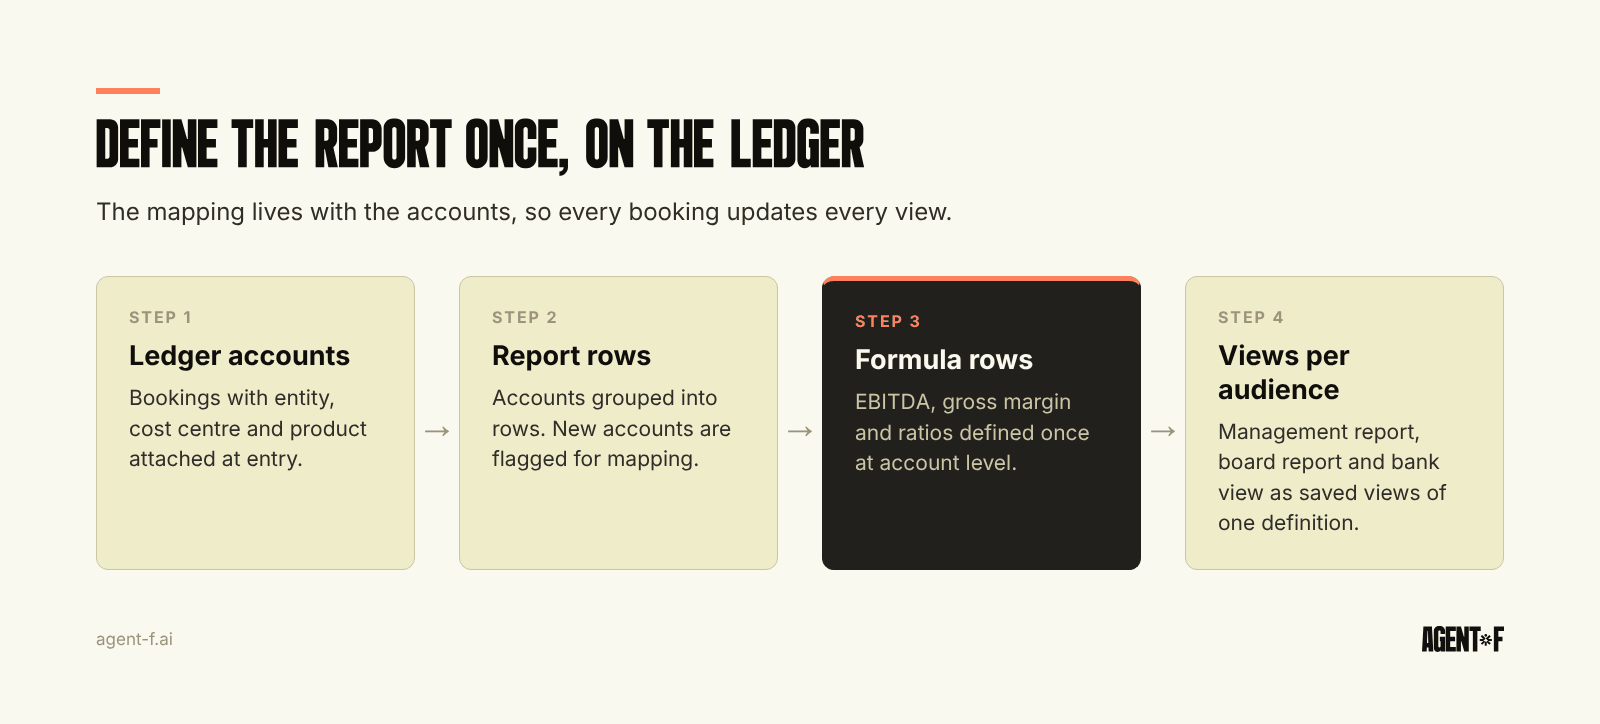
A management report is a set of rows, and each row is one of four things:
- Account rows: a group of ledger accounts, such as all SKR04 personnel accounts (SKR04 is the standard German chart of accounts used by many companies and tax advisors) rolled into "Personnel".
- Formula rows: a calculation on other rows, such as EBITDA, gross margin or personnel cost as a share of revenue.
- Dimension filters: the same rows cut by entity, cost centre, product or customer.
- Notes and adjustments: a comment on why a number moved, or a manual adjustment that is labelled and traceable.
On top of the rows sit columns: actual, budget, prior year, variance. On top of that sits the audience: the management team sees everything, the board sees a condensed version, the bank sees the covenant view. The work is in defining the rows once, carefully, and then never touching the mapping by hand again.
How should you define EBITDA so it means the same thing every month?
EBITDA stands for earnings before interest, taxes, depreciation and amortisation. Because it is not a statutory line, every company defines it itself, and the definition drifts when it lives in a cell formula.
Write the definition down at account level. Start from the operating result, then add back depreciation and amortisation, which in the total cost method is its own item. Decide explicitly where the grey areas go: leasing costs, write-downs on receivables, capitalised own work, other operating income from asset sales.
Then define adjusted EBITDA separately, if you need it. Adjustments for one-off items, such as a restructuring, a financing round or a legal dispute, should be tagged on the booking itself, not subtracted in a spreadsheet. That way the board sees the same adjustment the auditor can trace, and the next controller understands why the number differs from the plain EBITDA.
The test is simple: if two people build EBITDA for the same month independently, they should arrive at the same figure without asking each other.
Why does the Excel version break every few months?
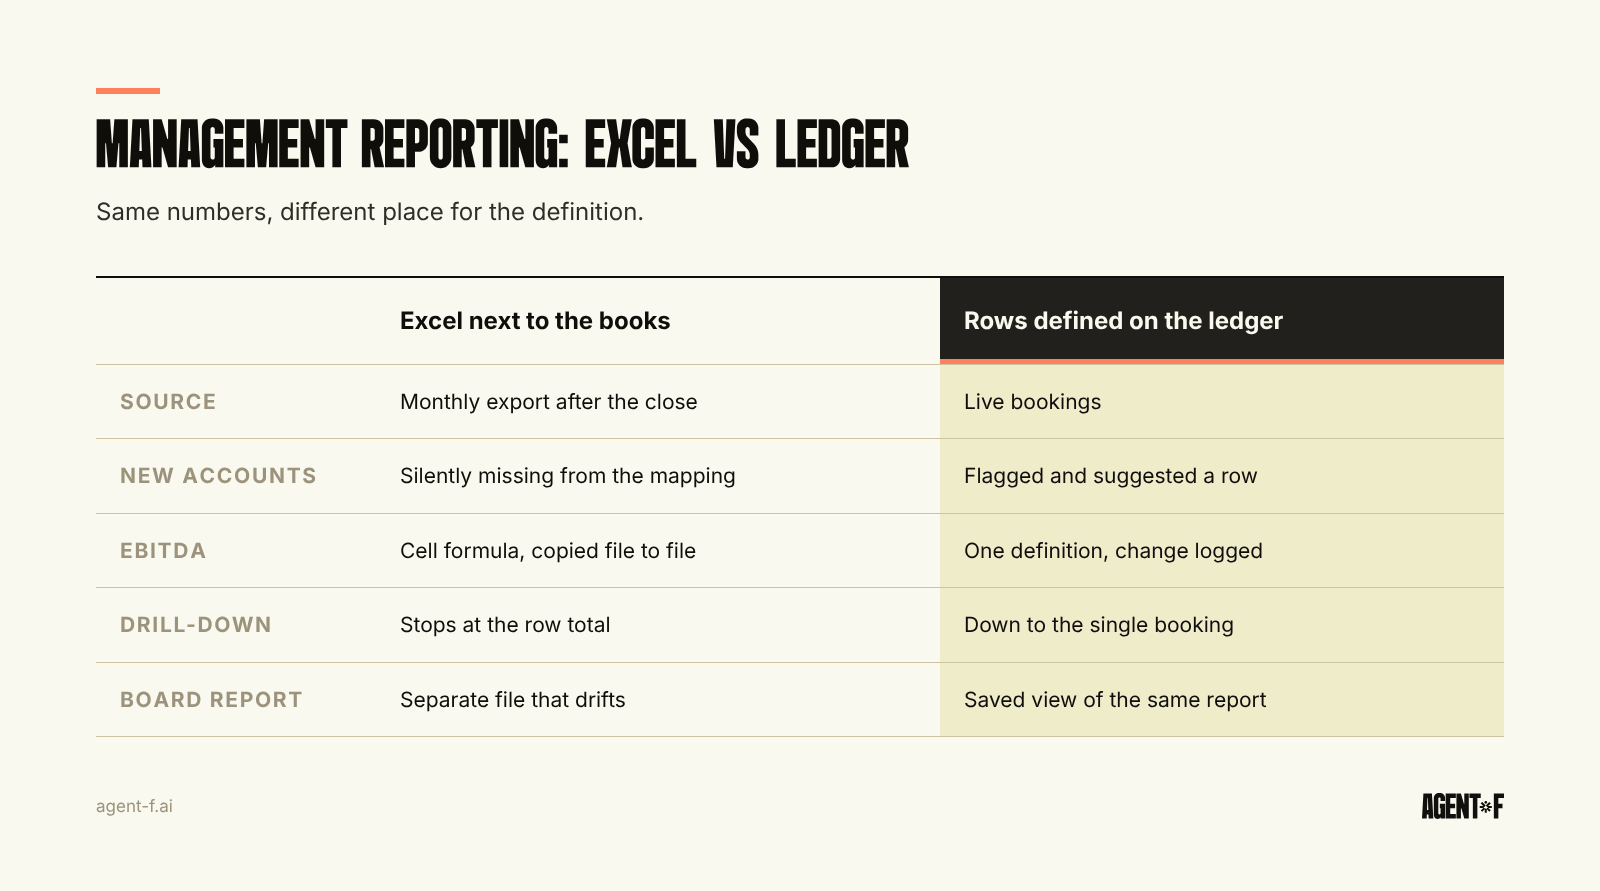
The spreadsheet management report works until something changes. The tax advisor opens a new account for a new type of cost. A second entity is added with a slightly different chart. A cost centre is renamed. Each change is small, and each one silently drops a number out of the mapping.
The usual symptoms are familiar. The management P&L no longer adds up to the statutory result, and someone spends a day finding the difference. The board report shows last month's EBITDA definition because the formula was copied from an old file. Drill-down stops at the row total, because the export holds balances, not bookings. There are 100 different Excel sheets flying around, and nobody is sure which one went to the investors.
The deeper problem is timing. The export happens after the close, so the report is always a snapshot of a month that is already over. We describe that lag in real-time financial reporting. A definition that sits on the ledger fixes both issues: new accounts are flagged for mapping when they are created, and the report refreshes when a booking is made.
How do you report per entity and cost centre without a consolidation spreadsheet?
Per-entity and per-cost-centre views only work if the dimensions are booked with the transaction. A cost centre added later in Excel is an allocation, not a fact. Set up cost centres so they match how you manage, and make them mandatory on cost bookings. Our guide on cost centre accounting covers how to do that so the structure survives the DATEV export to your tax advisor.
For several entities, the management report needs three things the BWA does not give you: the entities side by side, a group total with intercompany items removed, and a common row structure even if the charts of accounts differ slightly. When the rows are mapped once per entity in the same system, the group view is a filter, not a project.
The analysis that follows, finding what actually drove the margin, is a separate step. We cover it in P&L analysis.
How do you turn the management report into a board report?
A board report is the management report condensed for people who meet quarterly. It usually needs the P&L in your structure with budget and prior year, cash and runway, three to five KPIs, and a page of commentary. Our article on board reporting covers what investors expect in it.
The mistake is building the board report as a separate file. If the board version is a saved view of the same report definition, with fewer rows and an added commentary page, it cannot drift from what management sees. Lock the period after the close so that the numbers sent to the board are the numbers in the ledger, and keep the commentary next to the figures it explains.
How does Agent F help with management reporting?
In Agent F, the management report is defined on the general ledger itself. You can describe the report in plain language, for example "a P&L per entity with EBITDA, personnel costs per cost centre and a variance column against budget", and the system proposes the rows, the account mapping and the formulas. A person reviews the proposal, adjusts it and saves it. From then on, the report refreshes from live bookings.
When a new account is created, Agent F suggests which report row it belongs to, with a confidence score, and asks for approval instead of letting the number fall out of the report. Adjustments for adjusted EBITDA are tagged on the booking. Every change to the report definition is recorded in the audit trail, so you can see who changed the EBITDA formula and when.
Because finance, operations and people share one data model, the report can draw on more than accounts: payroll for personnel costs per cost centre, budgets from planning for the variance column. The BWA and the DATEV export to your tax advisor come from the same ledger, so the management view and the statutory view reconcile by construction. You can also ask questions on the report in plain language, such as why marketing in the second entity is above budget, and drill down to the individual bookings.
To get started, write your current EBITDA definition down at account level and compare it with what last quarter's board report actually used. List every account that is not mapped to a row in your spreadsheet. Then pick one report, usually the monthly management P&L, and rebuild it once on the ledger instead of in a file.
Learn how Agent F works, or see it on your own ledger at agent-f.ai/demo.
This article is for general information only and does not constitute tax or legal advice. Parts of it were generated with AI. Please consult your tax advisor or legal counsel before acting on it, and feel free to reach out at team@agent-f.com with any questions or for support.